Whole Earth Forecaster Home
Economics
As yet we know far too little about the origin of mass attitudes, their spread among people and the effects of different attitudes on action. But what we do know is that economic psychology may usefully supplement the theoretical and statistical approach of traditional economics. It contributes to the understanding and prediction of economic fluctuations, and thereby promises to provide poly makers with better tools which they may use to combat the recurrence of periodic depressions and inflations.
- Dr. George Katona, Professor of Economics and Psychology, University of Michigan.
- Scientific American, 1954
Despite government and private economists' optimism, the economy is still in recession and it looks like 1992 will come before the economy shows any real strength. Way back in the February 1990 issue of WEF I forecasted that the economy was peaking and that it would bottom in 1992. That looks now to be an excellent forecast.
- Whole Earth Forecaster newsletter, October 1991
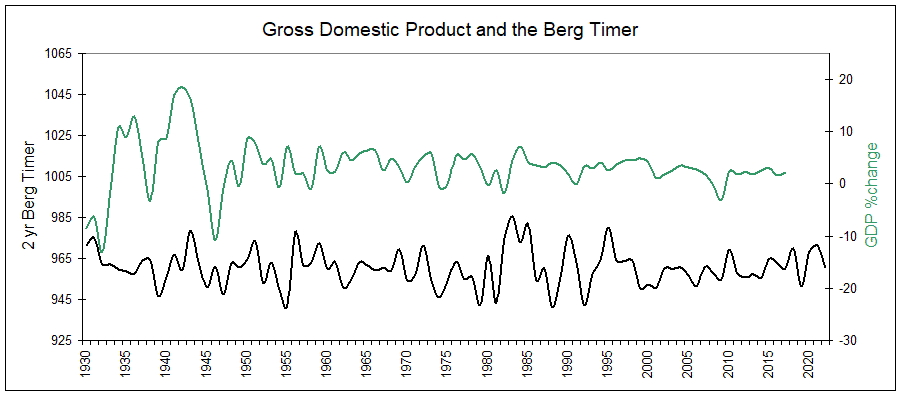
Gross Domestic Product 
Below are compared the U.S. Gross Domestic Product (annual % change, above) and the 2-year moving average of the Berg Timer (below).
written/published December 2012:
The Berg Timer forecasted the 40's wartime economic boost, the strong early 1950's, the decline of '74, the roaring 1980's with its strong move up, the decline into 2009, and the move up in 2010. But that is short-lived. The economy should struggle until 2015. A move up of the economy in 2015 will obviously be credited to President Obama and should help the next Democratic presidential candidate in his/her campaign in 2016.
written/published January 12, 2019: The economy didn't recover in time for the 2016 election, thus Republican Trump won. As BT then moved up into 2018 the economy also moved up, helping Trump participate in the recovery. The economy should pause in 2019 then continue strongly into 2021. So President Trump will suffer blame for what his opponents will say is the end of the strong economy. But it is not the end of the economic surge. It will continue up into 2020-21, enabling Trump to win re-election in 2020. Planetary positions (the Berg Timer) can forecast political popularity because it can forecast human behavior, optimism and pessimism.
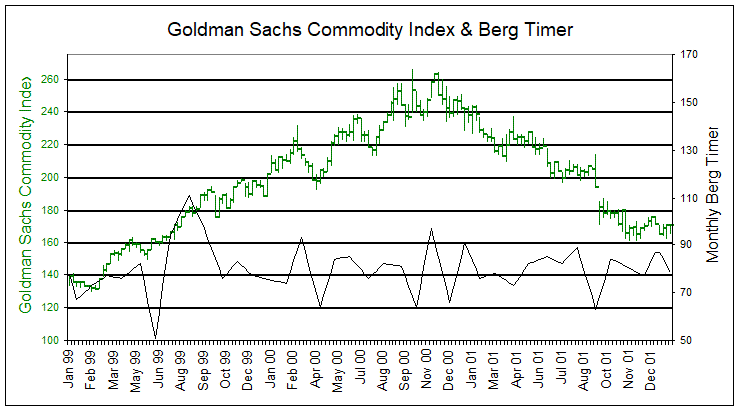
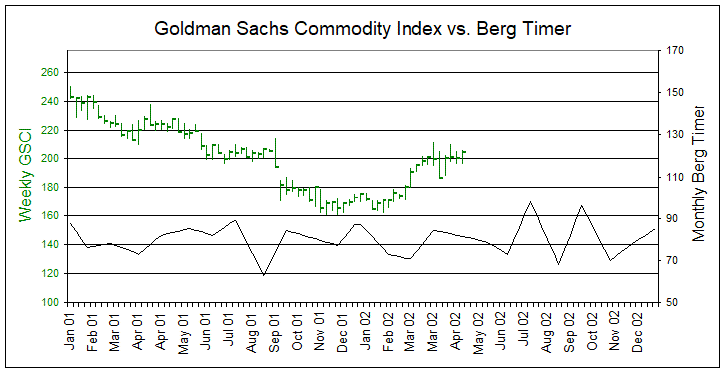
Commodities, Standard & Poors' Goldman Sachs Commodity Index
Below are compared the weekly Goldman Sachs Commodity Index and monthly Berg Timer from 1999 through 2001.
I wouldn't want to be on the wrong side of monthly BT when trading a broad commodity index.
The Goldman Sachs Commodity Index is a composite of 26 commodities from all commodity sectors: six energy products, eight metals and twelve agricultural products (4 grains/5 softs/3 meats). Possible means of implementation include the purchase of GSCI-related instruments, such as the GSCI futures contract traded on the Chicago Mercantile Exchange (CME) or over-the-counter derivatives, or the direct purchase of the underlying futures contracts.
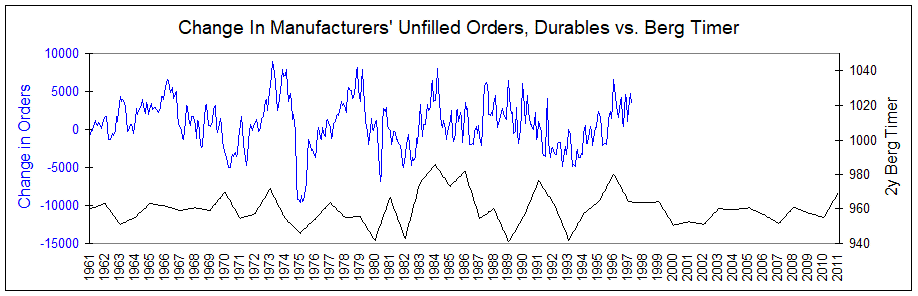
Durable Goods Orders
Below are Manufacturers' Durable Goods Orders and the 2-yr Berg Timer (lagged one year) since 1961 and forecast to 2011.
This positive correlation is about the same with most macro-economic indices compared to BT. BT correctly forecasted the major lows of 1963, 1967, 1975, 1982, and 1993.
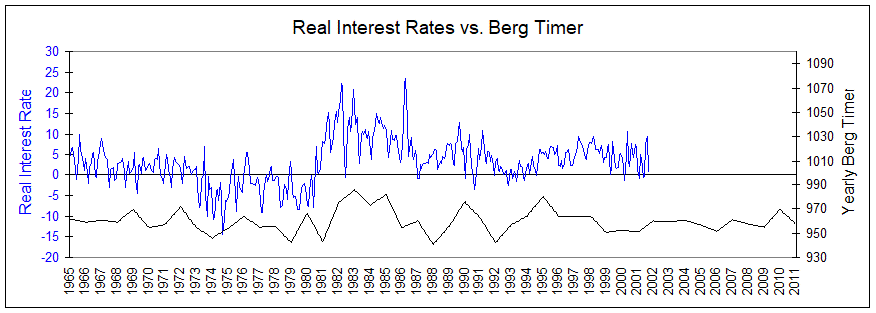
Interest Rates
Below are compared Real Interest Rates and the 2-yr Berg Timer since 1965 and forecast to 2011.
A 'real interest rate' is defined as interest rate minus inflation. The above real interest rate was calculated by subtracting the Consumer Price Index from the 3-Month T-Bill rate. BT correctly forecasted the major low in rates in the early 1970's, the large bubble in rates during the late 1970's and many other smaller highs and lows.
The real interest rate represents the real cost of money and is a good indicator of the business cycle.
"Perhaps the strongest observation to be made is that real rate peaks and troughs appear to have an established relationship with business cycle peaks and troughs. Every postwar business cycle peak follows a peak in the real rate series and a real rate trough occurs either with or shortly after a business cycle trough. This observation is consistent across the eighteen series we constructed."
Michael Dotsey and Brian Scholl. The Behavior of the Real Rate of Interest over the Business Cycle. Federal Reserve Bank of Richmond Working Paper No. 00-9. August 2000.
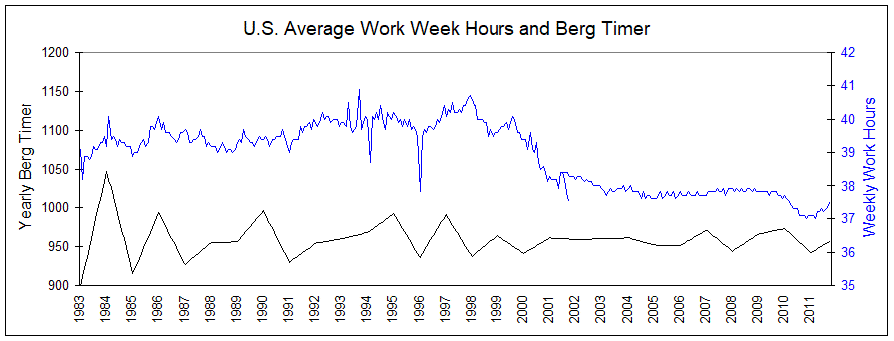
Work Week Hours of Production
Below are Work-Week Hours of Production and yearly Berg Timer from 1983 to 2011.
Work Week Hours is a basic macro-economic index of the state of the economy, a useful tool for management. The correlation here between Hours and the Berg Timer is very positive. The Hours data has been spliced in at July 2001 due to the previous index being discontinued.
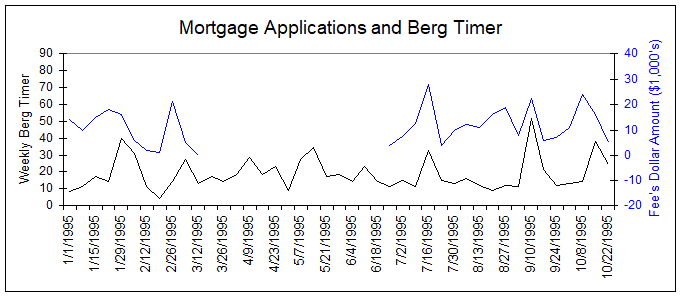
Mortgage Applications
Below are compared total weekly mortgage fees from applications and weekly Berg Timer in 1995.
The data is from a broker at a mortgage brokerage business in Miami (data unavailable Apr-June). The broker sent me the data after noticing a correlation between weekly BT and the amount of fees they took in each week.
This is further evidence that housing sales are affected by weather and/or human excitability.
Data source: Mortgage broker wishes not to divulge his name.