Whole Earth Forecaster Home
The fellow that can only see a week ahead is always the popular fellow, for he is looking with the crowd.
But the one that can see years ahead, he has a telescope but he can't make anybody believe he has it.
Will Rogers, The Autobiography of Will Rogers, 1949
Weather 
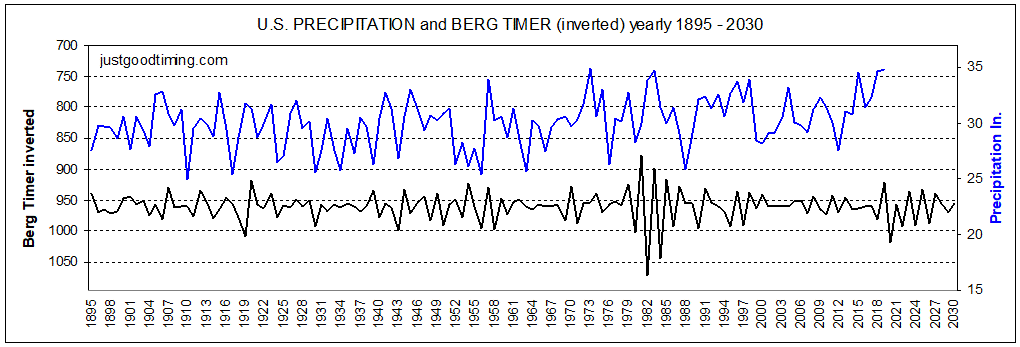
U.S. Long-Term Precipitation
Below are compared precipitation and the yearly Berg Timer (inverted) since 1895 with forecast to 2030. Negative correlation. High BT = Low Precip.
On a daily basis, precipitation and temperature vary with respect to the Berg Timer depending upon the location. Weather systems are tricky and don't akways follow the same paths. So if you want to know your locations daily response to precipitation and temperature it's necessary to consult your state's profile which you can find on the Mapping & BT Data Page.
The major bottoms of BT correctly forecasted drought for the early 1930's, mid-50's, and 2020. The BT has had very low volatility since the early 2000's, the start of a creeping up drought to 2020 forecasted long ago now occurring globally.
Forecast published Feb 2010: Our last drought ended in 2002 as forecasted. Precipitation increased in 2003 and peaked in 2004/2005 as forecasted. Then a decline into 2007 (which we got). The years 2014-2015 will be very dry, probably drought years.
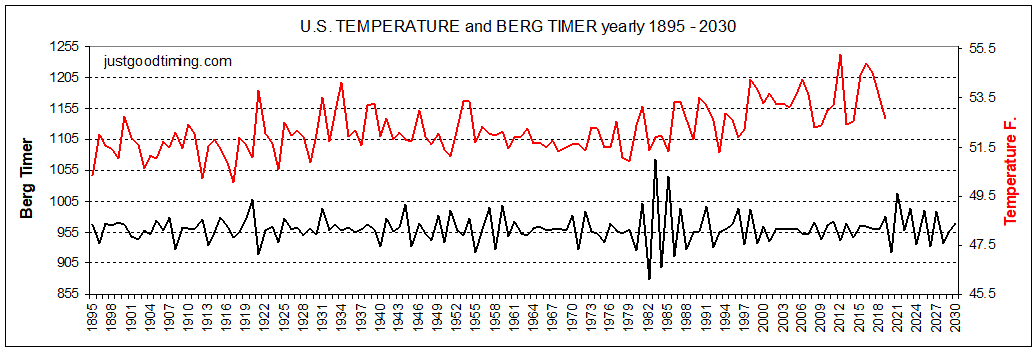
U.S. Long-Term Temperature
Below are compared yearly temperature average and yearly Berg Timer since 1895 with forecast to 2030. BT has been lagged one year for best fit. Thus BT's value for 1895 is what happened in 1896, etc...
Positive correlation, High BT = High Temperature, which makes sense since High BT correlates positively with low precipitation.
This positive correlation holds true for monthly time frames.
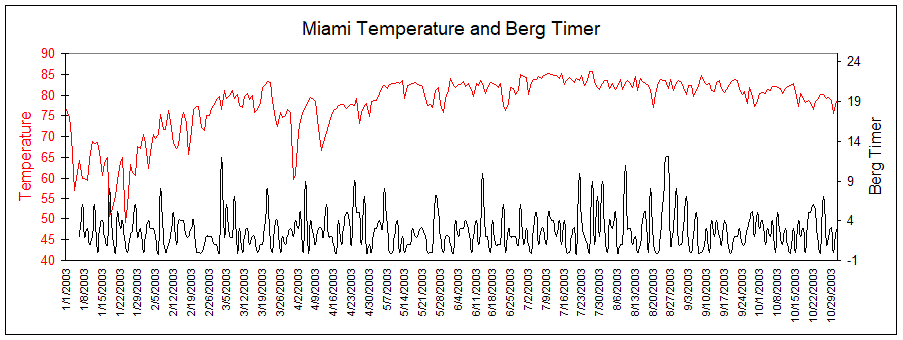
Local Temperature
Want to know when it will be REALLY hot in Miami? Below are compared daily mean temperature in Miami and the Berg Timer. High daily Miami temperature correlates positively with strong daily Berg Timer.
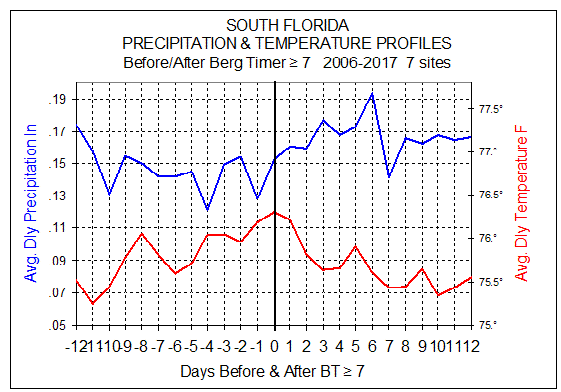
Here is the South Florida weather profile. High BT occurs at day '0'. Temperature is strongest at day '0' and precipitation lowest.
Now everyone in South Florida know when it will be really hot in the future using daily BT. And they know it is likely to rain 5 to 6 days after strong BT greater than '7' strength. You can do the same for any other location in the U.S. by using your state's weather profile found on the BT Data and Mapping Page.
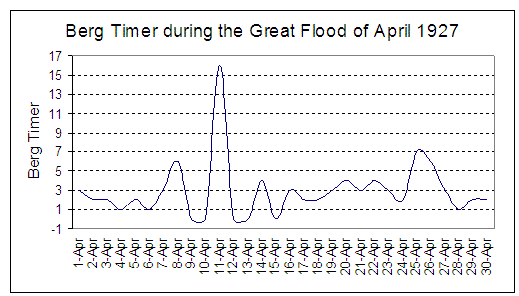
The Great Flood of 1927 - how very strong BT correlates and how it changed political history
The Great Mississippi Flood of 1927 was the most destructive river flood in the history of the United States. The flood unleashed a spring season of catastrophic events along the banks of the Mississippi River.
The Berg Timer hit an extremely high 16 strength on April 11, 1927
A weather system that stalled over the Midwestern states brought heavy rainfall to the Yazoo-Mississippi Delta, an alluvial plain located in northwest Mississippi. In early April 1927, Henry Waring Ball of Greenville, Mississippi, wrote in his diary:
April 8, 1927
at 12 it commenced to rain hard and I have seldom seen a more incessant and heavy downpour until the present moment - 9 p.m. The water is now at the top of the levee, and we have heavy showers and torrential downpours almost everyday and night. The air is saturated with moisture, and the luxuriance of plant growth is extraordinary.
April 15
The worst Good Friday I ever saw. A night of incessant storms, wind, lightning, thunder and torrents of rain. Raining constantly all this morning, none of us slept much. A day too dark and stormy to go to church or even out of doors. Discomfort. Flowers and plants beaten to the earth, little half-drowned chickens in baskets in the kitchen, house leaking in many places. Everybody in a bad humor. River appallingly high, and levees in very precarious condition. Too dark to write, another big storm coming - noon.
April 16
Yesterday and last night were somewhat memorable. It rained in torrents and almost without intermission for nearly 48 hours. More than 10 inches fell. A 12-inch fall is reported for Cairo. ...
The flood affected Arkansas, Illinois, Kentucky, Louisiana, Mississippi, Missouri, Tennessee, Texas, Oklahoma and Kansas. Arkansas was hardest hit, with 14% of its territory covered by floodwaters. By May 1927, the Mississippi River below Memphis, Tennessee, reached a width of 60 miles (97 km).
Political effect of the flood --- The Republicans had strong backing from African Americans in 1927, ever since the times of Republican President Lincoln. However, when Republican President Herbert Hoover failed to carry out his promises to provide levee-building funds to the south after the flood, African Americans moved in droves to support Democrats, which has been sustained to this day. Thus, the effects of the Berg Timer and weather upon history.
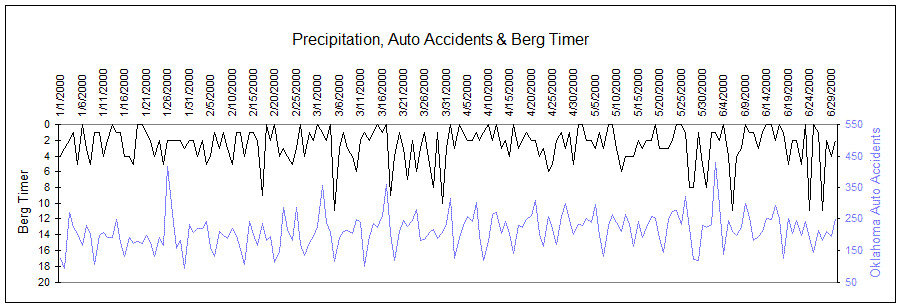
Precipitation and Auto Accidents
Since Daily BT can forecast precipitation, it's not surprising that BT can also forecast automobile accident rates. Below are compared total daily auto accidents in Oklahoma and daily Berg Timer (inverted) for the first half of 2000. Below that is a chart of Daily Tulsa Oklahoma Precipitation for the same period. BT has been shifted five days to the right to account for the five day lag period for Oklahoma.
Precipitation is red line directly above
Almost every peak in accidents coincides with a bottom in BT (BT has been inverted for easier viewing). Law enforcement and health agencies all over the world can use this to prepare for probable high accident periods.
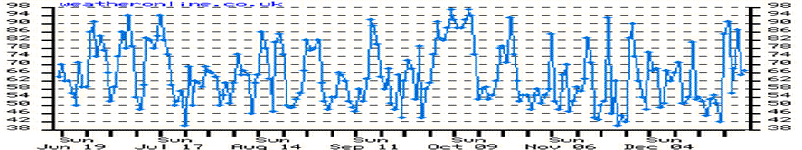
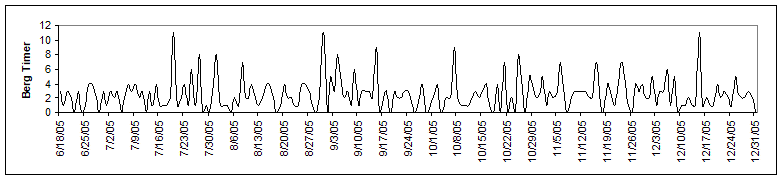
2005 Humidity in New York City
Below are compared New York City humidity and Berg Timer for the last half of 2005. When BT is high humidity is high. You can greatly reduce chances of precipitation and high humidity by scheduling your outside activities when BT is low.
Great for planning grand openings, athletic events, concerts, camping, etc..
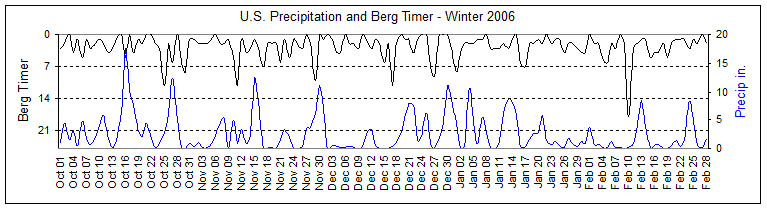
Winter Storms
A major storm occurred 9 out of 10 times immediately after a BT value of "7" or higher.
The Berg Timer accurately forecasted the first major winter storm for early December 2006.
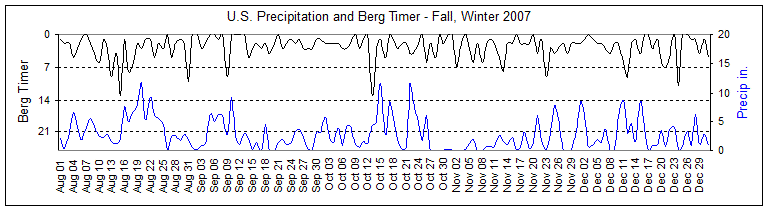
Below is U.S. precipitation data compared to the Berg Timer for Fall-Winter 2007. See how the major storms occur just before and after strong Berg Timer days, especially just after strong BT days.
source: http://climod.unl.edu/ The combined daily precipitation totals of 30 geographically representative cities throughout the United States.
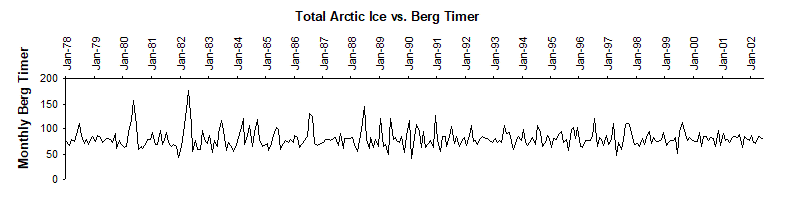
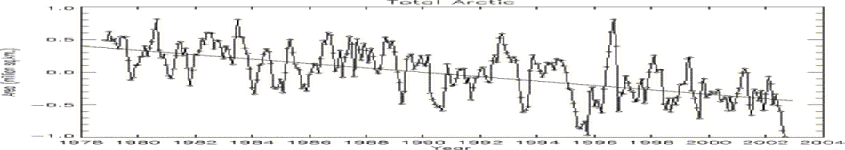
Arctic Ice
Below are compared Total Arctic Ice (departure from monthly means, Northern Hemisphere, million sq.k.) and The Berg Timer (shift delay of one month for more precise fit) from 1978 to 2002.
Major peaks and bottoms of BT and Arctic Ice correlate well. The previous Temperature correlations show that High BT = Low Temperature. So this correlation, High BT = More Ice, is consistent with the temperature analysis.
Lightning
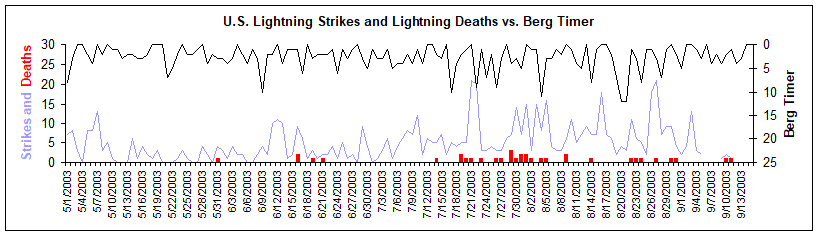
Below are compared lightning strikes causing damage and deaths in the United States and the Berg Timer for 2003.
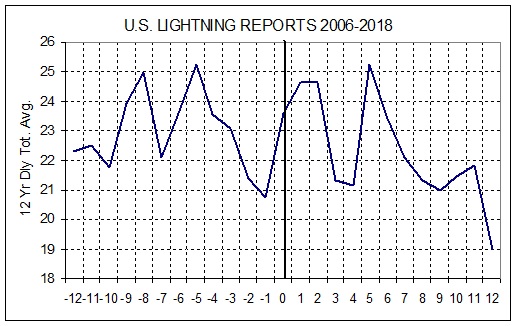
The new Lightning Profile for 2006-2018 shows that it's most likely 5 and 8 days before and 5 days after day '0', a day of strong BT >6 strength. Looking at the 2003 lightning chart notice the many occurrances on July 22, five days after the very strong BT on July 18. The same outbreak occurred before and after the strongest BT of August 21-22. The profile above accurately useful for the year 2003. The profile is reliable even back in 2003. This demonstrates the useful consistency of BT profiles.
From May 1 to September 15, 2003, there were 35 deaths, 203 injuries and $23.5 million in property damage caused by lightning.
Wildfires
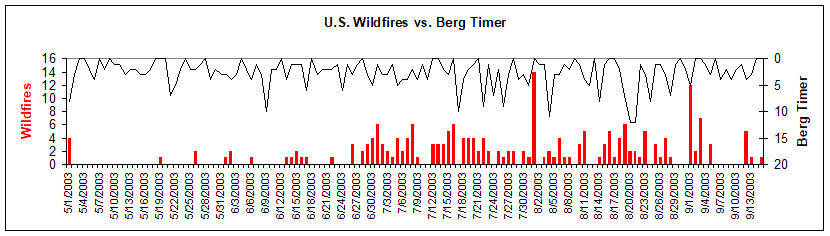
Below are compared wildfires in the United States and the Berg Timer for 2003.
This is the same time frame as the above lightning chart. Lightning causes most all wildfires. So, like lightning, when BT is high, wildfires are most likely just before and after it. From May 1 to September 15, 2003, there were 2 deaths, 54 injuries and $85 million in property damage caused by wildfires.
Hail Storms
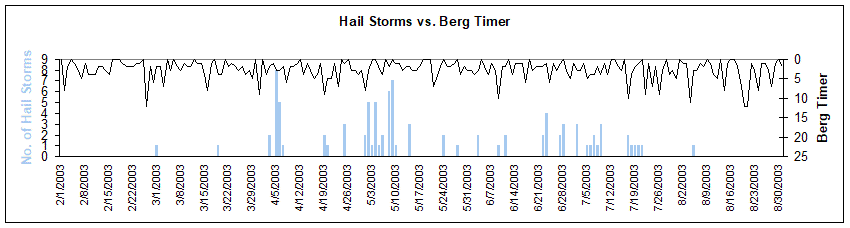
Below are compared Hail Storms (hail 3 inches in diameter or larger) causing damage in the United States in 2003 and the Berg Timer.
Severe Hail Storms are most probable when BT is low just before and after strong BT.
These storms caused 6 injuries, $26 million in property damage and $6 million in crop damage. You'll find on the Natural Disasters page that tornadoes also are more probable when BT is low.
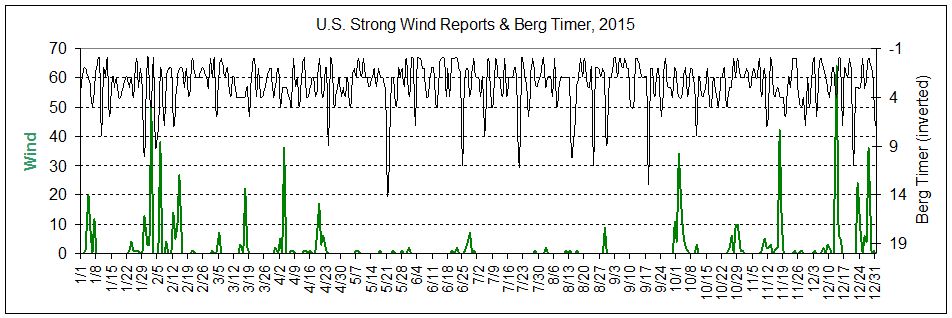
U.S. Wind Speed
Below are wind speed in the United States and Berg Timer for 2015. Strong winds are most likely in the low BT periods just before and after high BT, as is the case with most all indices related to BT.
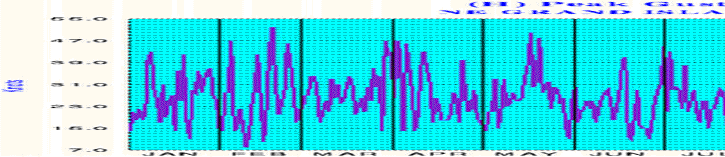
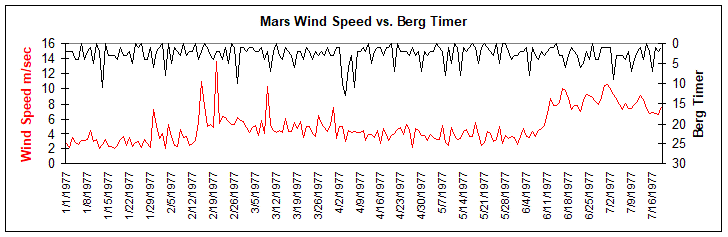
The Viking I and II spacecraft gathered weather data from Mars. Below are compared daily wind speed on Mars, wind speed at Grand Island Nebraska (blue line), and the daily Berg Timer for 1 January through 20 July 1977.
Notice how the wind speeds of Mars and Nebraska share exact peaks and bottoms. This is because the timing of weather systems on both planets are caused by the same thing! We will continue to see this correlation with other planets. I hypothesize that the fluctuations in solar wind, predictable using the Berg Timer, cause the same timing of weather systems on all planetary bodies in the solar system that have an atmosphere. I've shown how Moonquakes share the same timing as Earthquakes, thus we can extend this to assert that all planetary bodies share similar timing of both weather and seismic activity due to a common cause, that cause being planetary position as represented by the Berg Timer.
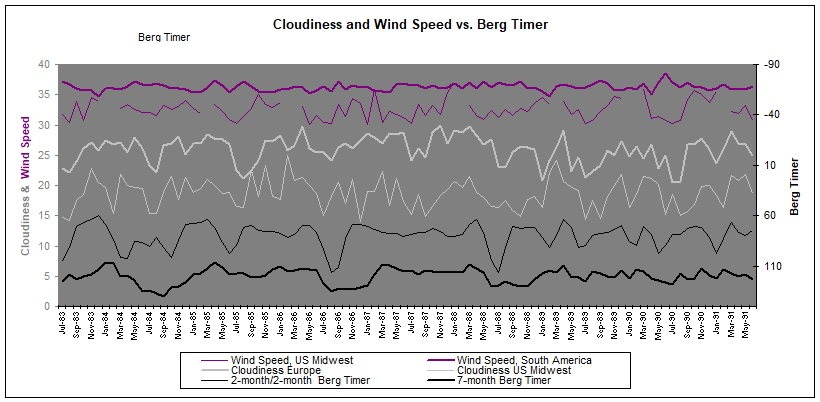
World Cloudiness, Temperature and Wind Speed
Below are monthly cloudiness in the United States Midwest and Europe, and monthly wind speed in the U.S. Midwest and South America compared to the 7-month and 2-month/2-month moving averages of the monthly Berg Timer.
The U.S. cloudiness and wind speed indices cover the area 33.75 to 46.25 N latitude by 93.75 to 106.25 W longitude, an area covering the central U.S.. The Europe cloudiness covers the area 38.75N to 58.75N by 36.25E to 11.25W, which is the entire European continent. The South America wind speed area is 10S to 40S by 60W to 80W.
Both the U.S. and Europe share the same negative correlation to cloudiness. High BT = Low Cloudiness. This makes sense considering the Precipitation correlation of High BT = Low Precipitation of land areas (opposite for ocean areas).
source: IRI Data Library.
I've researched the cloud data for all world-wide locations and have found that there are two specific, broad connected areas which respond differently, one positively and the other negatively to the Berg Timer.
The positive correlations between cloudiness and BT cover an area from Canada westward through Asia, then down through India, covering all of Africa except South Africa. Then it continues down through the Indian Ocean to Australia and Antarctica.
The negative correlations between cloudiness and BT cover an area starting in the Middle East going west through Europe, then covering the entire Atlantic Ocean area including the Arctic. Then continuing west through the continental United States and into the Mid and South Pacific.
Basically speaking, the positive correlations between cloudiness and BT cover an area in a "U" shape from Canada down through the America's (except U.S.) to Antarctica, then up through Australia, Africa and Asia.
The negative areas cover mostly the Atlantic Ocean area except Antarctica and the Mid to South Pacific.
The land areas which are in the negative areas are the Philippines/Indonesia, U.S., Europe to the Middle East and South Africa.
I studied wind speed from these areas and found that when cloudiness is high, wind speed is high, and when cloudiness is low, wind speed is low. This relationship is consistent for both the positively and negatively correlated areas. For instance, the chart above shows wind speed for the U.S. Midwest (a negatively correlated location with respect to BT) with its cloudiness. Wind speed follows cloudiness. Also shown is wind speed for South America, a positively correlated location. Note how wind speed for South America (a positive location) is opposite to the other indices. You'll find below all the locations and their particular response to BT (positive or negative). Wind speed and cloudiness will both move together in their respective locations, some locations moving the same, or positively with respect to BT and the others moving negatively, or opposite to BT.
Wind speed and cloudiness correlate positively because they are both effects shared by a moving weather front. As a front comes through, cloudiness is created by the rising warm air and the differences in pressure areas causes the increased wind.
Cloudiness - Berg Timer correlation locations:
|
Positive
|
Negative
|
Central Canada
|
Indonesia
|
Northern Canada
|
Philippines
|
Alaska
|
South Pacific Ocean
|
Bering Strait
|
Mid-Pacific Ocean
|
North Pacific Ocean
|
Western U.S.
|
Korea
|
NW U.S.
|
Siberia
|
Central U.S.
|
Moscow
|
NE U.S.
|
India
|
Bahamas
|
East & West Africa
|
South Atlantic
|
Indian Ocean
|
South Africa
|
Australia
|
Mid Atlantic
|
Antarctica
|
Greenland
|
Argentina
|
Arctic
|
Brasil
|
Europe
|
Venezuela
|
Middle East
|
Central America
|
|
Mexico
|
|
Texas/Mexico Border
|
|