Whole Earth Forecaster Home
Natural Disasters 
We waited omnipotently for the occurrence of The Berg Timer's strongest day of 1992 on October 18, a "21" strength day. We knew when, but where? It all started in Egypt on October 12. A powerful 5.9 quake struck Cairo killing 370. Then, on October 17 a 6.6 quake struck Colombia, South America. Then another quake hit Colombia, a 7.2 quake on October 18. California finally felt the push with a 4.7 quake and seven aftershocks on October 21. Then on October 24 a 6.7 quake hit Soviet Georgia. These quakes occurred between 6 days before to 6 days after BT's strongest day of 1992, just as I've forecasted.
- Whole Earth Forecaster newsletter, November 1992
See chart below of these quakes compared to The Berg Timer.
Earthquakes
Yearly Earthquakes
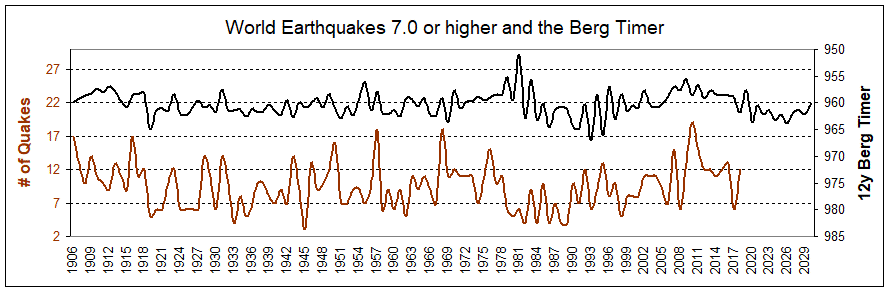
Yearly worldwide quakes 7.0 or higher are shown below since 1900 with forecast through to 2020. Latest data is through 2018. A very good correlation with inverted 12-yr Berg Timer. In addition to both sharing many yearly highs and lows, the general downtrend of both from 1981 to 1989 and uptrend of both from 1990 to 2011 are very interesting. And looking hard enough one can see a downtrend from 1906 to 1920 and an uptrend from 1920 to 1931 and down from 2010 to the present.
Daily Earthquakes
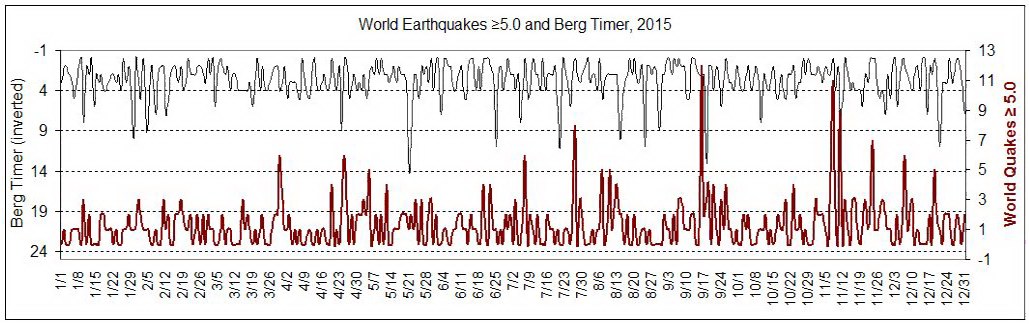
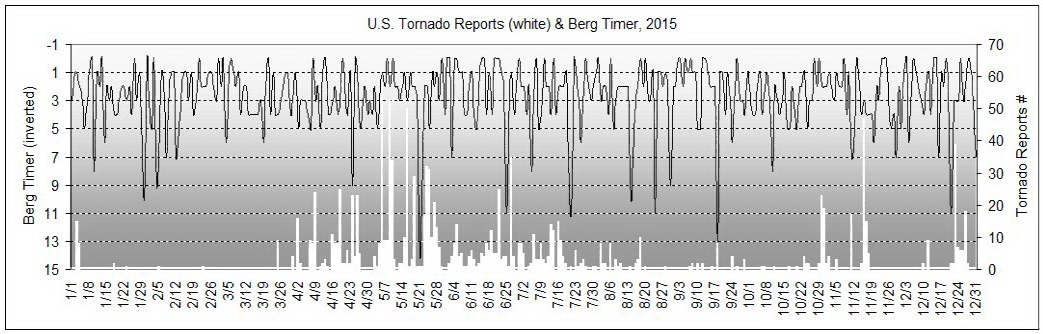
As in the yearly study above, the daily Berg Timer also correlates inversely with quakes. Here, world quakes compared to the Berg Timer in 2015. Quakes are most probable during the low BT periods just before and just after strong BT days (BT inverted in chart for easy viewing).
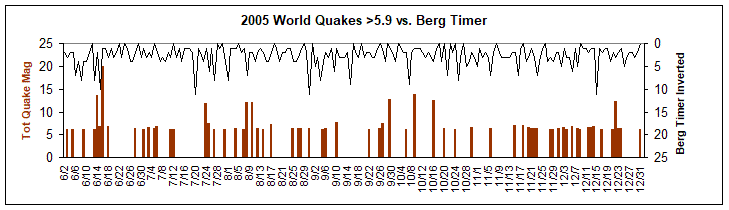
Below are compared daily world quakes > 5.9 and The Berg Timer for late 2005.
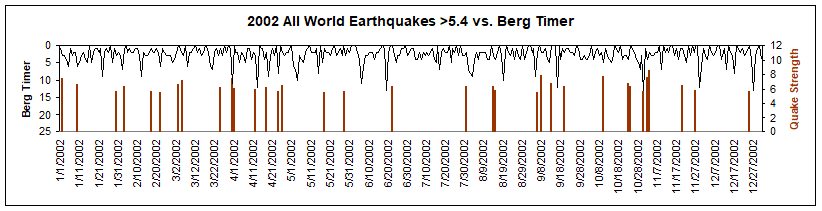
Below are compared all daily 2002 world quakes 5.5 or stronger and the Berg Timer.
These events met at least one of the following criteria: moderate damage (approximately $1 million or more), 10 or more deaths, magnitude 7.5 or greater, or Modified Mercalli intensity X or greater. Quake occurrances cluster around the strongest BT days.
The Great Cascadia Megathrust Earthquake of 1700
This immense quake was featured on the Discovery Channel on April 17, 2005. It occurred just before a very strong "15" strength BT day.
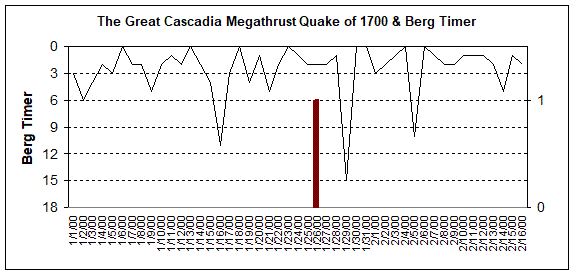
This great earthquake occurred about 9 pm on the night of January 26 in the year 1700. This was almost 100 years before the first European explorers made contact with native peoples on the west coast. The time and date of the earthquake are known because the large tsunami, or tidal wave, generated by the earthquake swept across the Pacific Ocean and did considerable damage at several places along the east coast of Japan. Japan has a written history dating to that time, and the size of the tsunami and its arrival time were well recorded. Using this, and other historical data, scientists were able to calculate the time of occurrence, location, and size of the generating earthquake. This was one of the world's great earthquakes with a magnitude estimated at 9. Oral traditions of the native peoples of Vancouver Island suggest the tsunami destroyed a village at Pachena Bay on the west coast of Vancouver Island, and that the shaking damaged houses in the Cowichan Lake region of south central Vancouver Island.
This earthquake occurred on the Cascadia Fault, the boundary between the North American and Juan de Fuca plates. This type of large earthquake is now known as a megathrust earthquake.
Morocco Quake of Feb 24, 2004
The devastating Morocco earthquake on February 24 killed 600 and left thousands homeless. It occurred within one week of very strong daily BT. The below forecast was publicly provided to newsgroups two months prior to the earthquake and was also published on this website. Again, strong quakes can be expected within one week on either side of very strong daily BT.
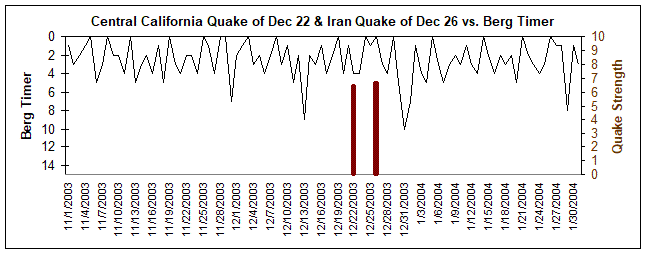
Central California and Iran Quakes of December 2003
The Central California and Iran quakes struck, as usual, during a low BT period just before a very strong BT day. Two people died in the California quake and 26,271 died in the Iran quake.
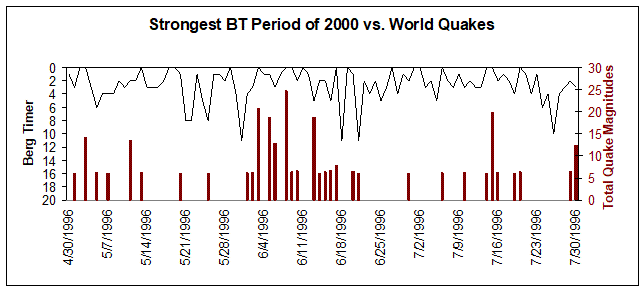
Below are the the total daily magnitudes of world quakes >5.9 for each day during May to July 2000 compared to the Berg Timer. Note the strong clustering of quakes between the two strong BT periods.
The strongest individual quake was an 8.0 which hit Indonesia on June 4, killing 103 with $6 million in damage. The strongest quake lines are when two or more quakes occurred on the same day.
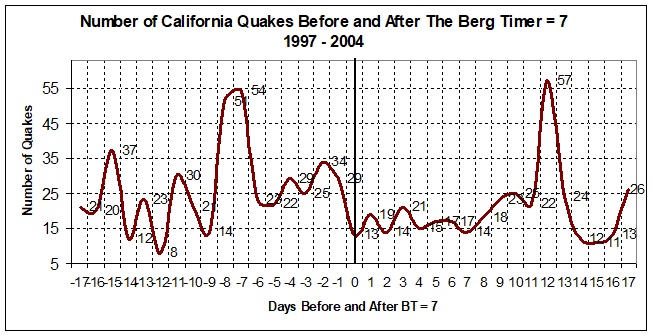
California Quakes
The profile above shows how California quakes are most likely during the 17 days before and after a Berg Timer strength of "7" or more. Up to 450% more quakes occurred on days -7 and -8 and on day 12 than at any other time. Notice the lowest probability of quakes during the period from day '0' to day '7'.
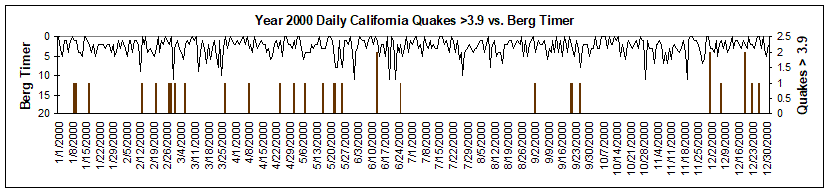
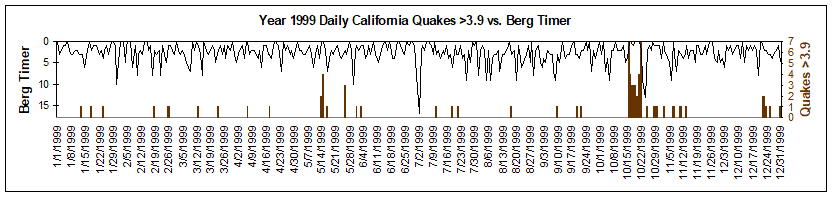
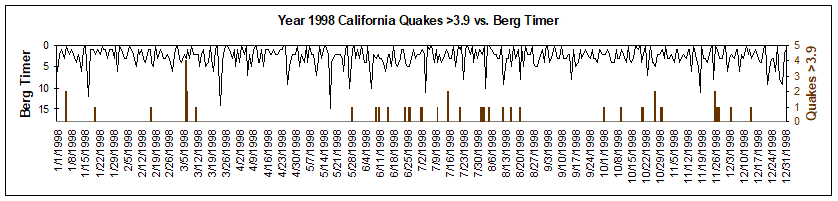
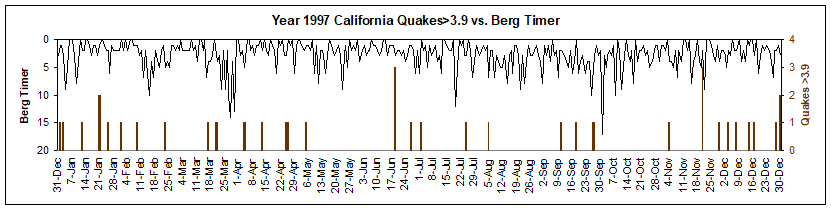
Below are compared daily earthquakes in California >3.9 and the daily Berg Timer for 1997 through 2000 upon which some of the above summary is based. The fewest quakes occur when BT is strongest (inverted peaks).
The correlation is quite consistent over all years studied. Most earthquakes occur when BT is very low just before strong BT. The strongest quakes occur when BT is very low for a sustained period of time just prior to strong BT as in mid-June above.
The strongest quake period above was mid-October 1999 when the Bullion Mountains (Hector Mine) 7.4 earthquake occurred. There was a prolonged period of low BT immediately before very strong BT. You should be aware of these periods if you live in a California.
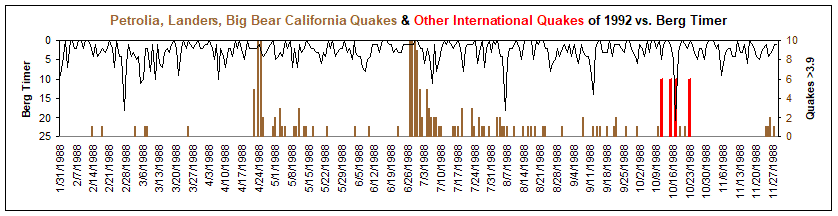
Other California Quakes and International Quakes
The three quakes shown above in red were discussed in my November 1992 issue of the Whole Earth Forecaster newsletter. Below is the excerpt:
"We waited omnipotently for the occurrence of The Berg Timer's strongest day of 1992 on October 18, a "21" strength day. We knew when, but where? It all started in Egypt on October 12. A powerful 5.9 quake struck Cairo killing 370. Then, on October 17 a 6.6 quake struck Colombia, South America. Then another quake hit Colombia, a 7.2 quake on October 18. California finally felt the push with a 4.7 quake and seven aftershocks on October 21. Then on October 24 a 6.7 quake hit Soviet Georgia. These quakes occurred between 6 days before to 6 days after BT's strongest day of 1992, just as I've forecasted."
- Whole Earth Forecaster newsletter, November 1992.
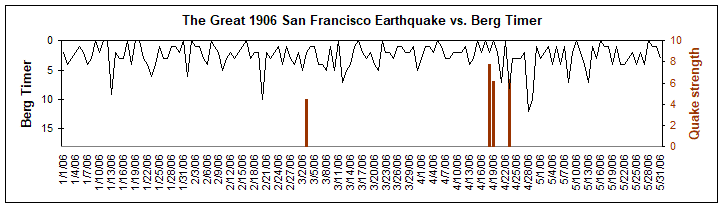
The Great 1906 San Francisco Earthquake
Below are compared the quakes occurring in California in 1906 and the Berg Timer.
California earthquakes are most probable just before strong BT days. The San Francisco quake struck on April 18, 1906, just before one of these strong BT periods. The 7.8 strength quake killed 3,000 with $524 million in property damage.
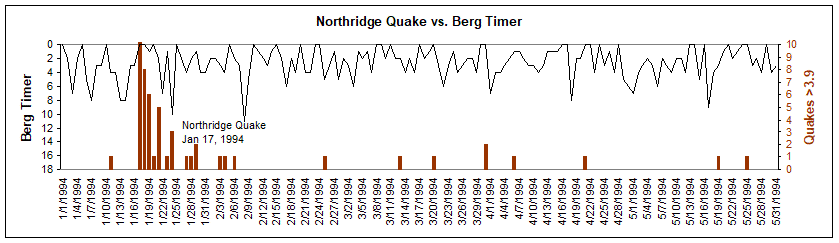
The Northridge Earthquakes of 1994
Below are compared California quakes >3.9 and the Berg Timer in early 1994.
The 6.7 Northridge quakes occurred on January 17, 1994, just before a strong Berg Timer period. Fifty seven died with more than 9,000 injured and $40 million in property damage. The quakes occurred during a sustained period of very low BT followed by very strong BT.
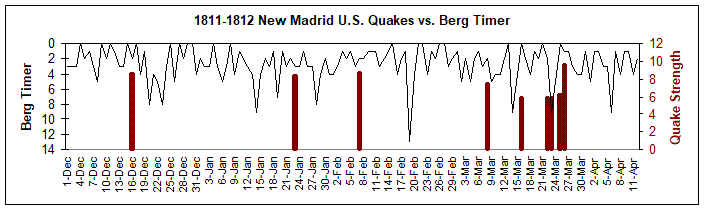
The New Madrid Earthquakes & Other World Quakes
Below are compared the 1811-1812 New Madrid Missouri quakes in the United States and the Berg Timer.
There were basicly four quakes referred to as the New Madrid quakes. The first two occurred on December 16 in northeast Arkansas. The third occurred on January 23 and was about the same strength as the first two. The fourth and final quake was the largest earthquake of the 1811-1812 series. As quoted from the USGS:
"Several destructive shocks occurred on February 7, the last of which equaled or surpassed the magnitude of any previous event. The town of New Madrid was destroyed. At St. Louis many houses were damaged severely and their chimneys were thrown down. The meizoseismal area was characterized by general ground warping, ejections, fissuring, severe landslides, and caving of stream banks."
All quakes occurred at BT lows just before or after high BT days. The final and strongest of the four Missouri quakes occurred just prior to the strongest BT day of the year, a "13" strength BT day on Feb 19.
The other quakes shown in March occurred in China (March 8), Venezuela (March 16), Rome (March 22), France (March 23), and four more occurred on March 26 in Caracas Venezuela.
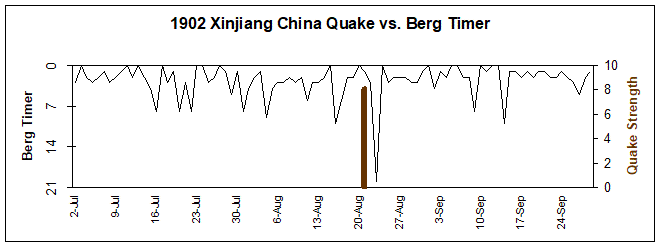
The Strongest Earthquake in Chinese History
On August 22, 1902, the strongest quake in China's long history hit the Xinjiang area. It was reported 8.1 in strength by international seismographers. The Chinese government rates it at 7.8.
The quake occurred just two days before one of the strongest BT days in history, a "20" strength BT day on August 24.
One of the Deadliest Earthquakes in Recorded History
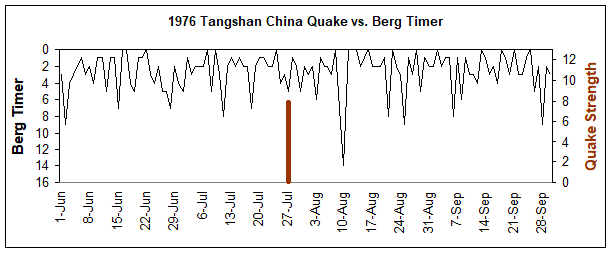
On July 27, 1976, a 7.8 quake hit Tangshan China, killing 240,000 people and causing $7 million damage. It occurred just before a very strong "14" strength BT day on August 10. It's listed by the source below as one of the most deadly quakes in recorded history.
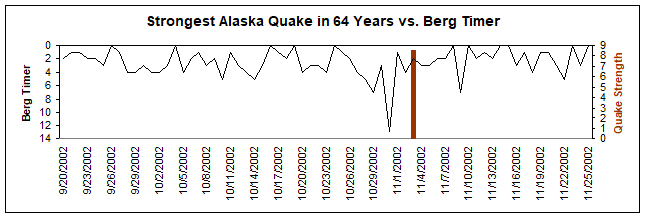
The Strongest Earthquake in Alaska in 64 Years
On November 3, 2002 an 8.4 quake struck Fairbanks Alaska just three days after the strongest BT day of the year.
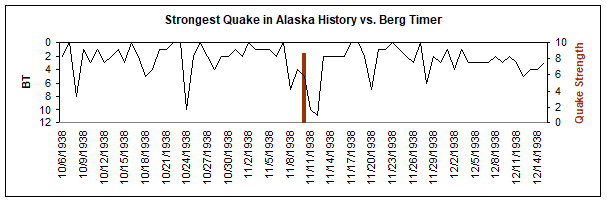
The Strongest Earthquake in Alaska History
On November 10, 1938 an 8.7 quake struck the Alaskan peninsula, just before the strongest BT period of the year (same data source as above).
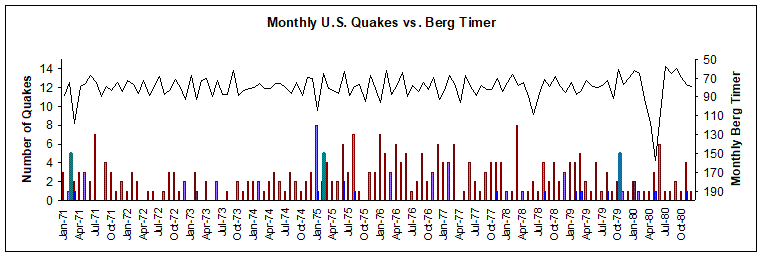
Monthly U.S. Earthquakes
Monthly earthquakes show the same correlation to Tthe Berg Timer as daily quakes---high quake probability just before and after strong BT. Below are compared monthly U.S. earthquakes and monthly BT from 1971 through 1980. This chart was first published in the February 1991 Whole Earth Forecaster newsletter.
The brown columns are the number of quakes each month >5.0. The blue columns are the number of quakes >7.0. Green columns are quakes >9.0. I exaggerated the green columns x 5 so they would be easy to see; the green columns each represent one 9.0 earthquake. Quakes are most likely to occur just before and after strong BT periods.
data source: Earthquakes of the United States. Hardbound book.
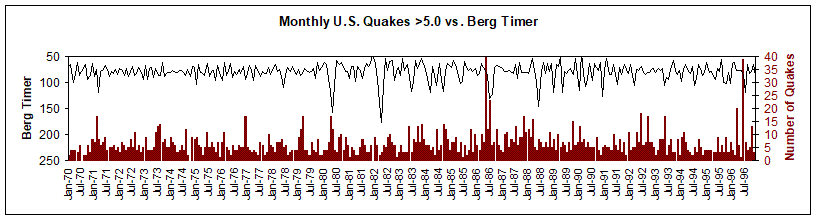
The chart below are quakes >5.0 from 1970 through 1996 compared to monthly Berg Timer using a different quake data source.
Quakes occur in clusters just before and just after strong BT periods.
Tsunamis
Most Tsunamis are caused by earthquakes so it's not surprising that Tsunamis correlate well with BT just like earthquakes.
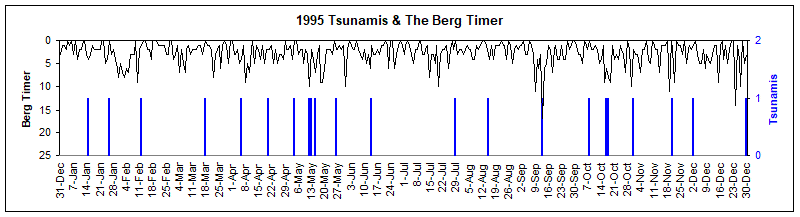
Each Tsunami event is shown below for the active year of 1995 compared to the daily Berg Timer.
Tsunamis are most likely just before and after strong BT.
The disastrous South Asia Tsunami of 26 December 2004 occurred just one day after a strong "9" strength BT day on December 25.
Moonquakes
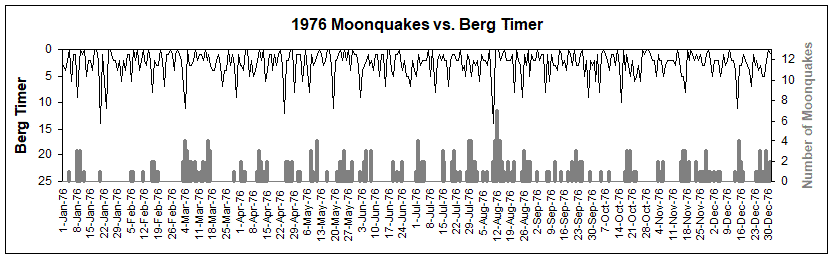
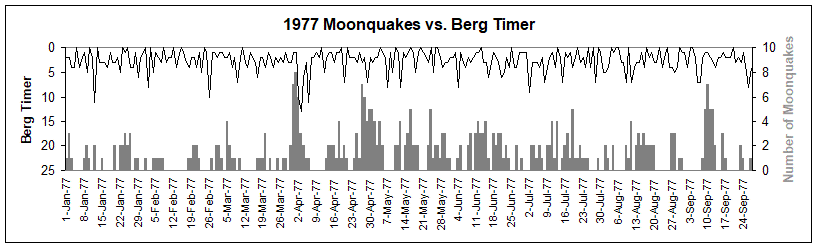
Between 1969 and 1972, six seismic stations were deployed on the lunar surface during the Apollo missions. Seismic data was continuously recorded until 1977. Below are compared daily Moonquakes for 1976 and 1977 and the Berg Timer.
Just like earthquakes, moonquakes occur in clusters just before and just after strong BT days. This makes a strong case for BT being new physics since it shows itself to work on extra terrestrial bodies.
The strongest daily moonquakes occurred within two days of the strongest BT days of both 1976 and 1977.
Both earthquakes and moonquakes share the same timing behavior with respect to planetary positions, as represented by BT.
The conclusion:
The mechanism causing seismic activity is the same on two different celestial bodies. I submit that when seismic data is collected from all planets, it will be found that all planets share the same seismic correlation to the Berg Timer.
Whatever the mechanism, when two planets are heliocentrically equidistant from a third planet (the definition of BT), seismic activity is caused on all planets immediately preceeding and following such configurations. The planets may act as armatures as they move through the solar system's interplanetary magnetic field, creating electromagnetic stress which affects all planets simultaneously within the field.
The name of this website should be changed to Whole Universe Forecaster.
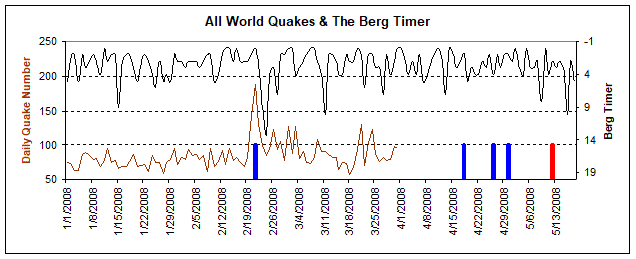
2008 Earthquakes
Quakes and BT fit together like a glove. Notice quakes making a strong surge just prior to the very strong BT day of 24 February, a perfect correlation. The blue columns are strong U.S. earthquakes which were highly publicized by the media occurring in Illinois, Nevada and California. The red column is a 7.9 Chinese quake which is estimated to have killed over 60,000 people. It occurred just before the strong BT day of May 16.
2005 Earthquakes
A 7.8 quake strikes Chile on June 13. A 7.2 quake strikes off NW California coast on June 15. A 7.3 quake hits off coast of Indonesia
on July 24. A devastating 7.6 quake hits Pakistan on Oct 8. All these major quakes triggered by strong BT. All quake-prone areas should be aware of high future BT periods.
Volcanoes
Krakatau
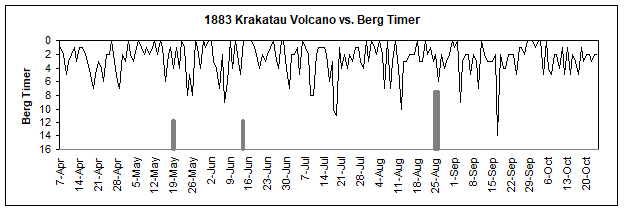
Below are compared the famous Krakatau Volcano eruption of August 26, 1883, and the Berg Timer.
Just like earthquakes, volcanoes occur just before and after strong BT days. Krakatau erupted just prior to the strongest BT day of the year, an unusually strong "14" strength day.
The eruption was preceeded by a column of ash and steam rising 11 km into sky from Perboewtan on May 20th and the top of Perboewtan being blown off in an eruption in mid-June (shown as smaller grey lines). 36,417 lives were lost, 32,000 from the tsunamis. The explosions were heard 4653 km away on the Island of Rodrigez in the Indian Ocean. A two meter high wave was recorded in Auckland, 7767 km away. The old island of Krakatau was destroyed. The former volcanic cones of Perboewatan and Danan fell into a hole in the crust which flooded with sea water. Only the southern part of Rakata remained. Two-thirds of the original island was destroyed.
Mount St. Helens
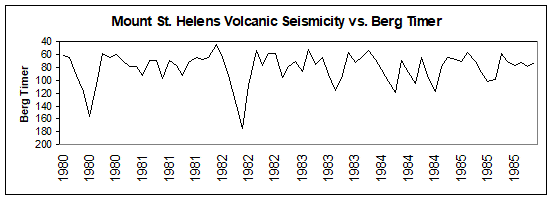
Below are compared Mount St. Helens Volcanic Seismicity and the monthly Berg Timer.
From the first eruption, May 18, 1980, Mount St. Helens seismicity continues to occur just before and after strong BT. The monthly BT values for the two strong months in 1980 and 1982 are the highest BT values of the 20th century. A monthly BT of equal strength occurs again in July, 2020.
The strongest BT day of 1991 on June 9 (a '12 strength' day) coincided with the following volcanic activity as reported by the Omaha World-Herald:
"Manilla, Philippines (AP) - A volcano began spewing ash Saturday (June 8) for the first time in 600 years, and authorities planned an evacuation of nearby Clark Air Base if volcanic activity increased. Mount Pinatubo, a 4,795-foot volcano about 60 miles northwest of Manila, sent steam 16,000 feet into the air and sent ash as far as 15 miles away."
"Tokyo (AP) - Mount Unzen, a volcano that claimed at least 37 lives less than a week ago, burst to life again Saturday (June 8), spewing superhot debris that set homes on fire and blacking out a nearby city of 45,000."
Tornadoes
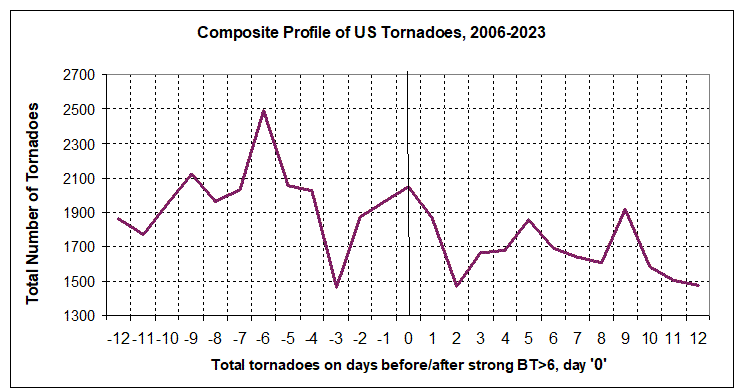
Below is the profile for U.S. tornadoes. It peaks at day -6 so tornadoes are most likely six days before day '0', a strong BT day when BT is equal to or stronger than seven strength. So if it's tornado season, late March to June, and it's six days before a strong Berg Timer day greater than 6 strength, and you are in an area which is succeptible to tornados, then stay close to weather news and be prepared to take cover in a strong enclosure if a tornado warning is issued. Texas is the most active state for tornadoes. Homes made of cinder brick are the safest.
Note that the tornado outbreak detailed below occurred April 3-4 of 1974. Also note that BT 6 days later on April 10 was a strong 9 value day. So that tornado
outbreak was forecastable had this profile been published before April of 1974. Maybe some day all TV/radio meteorologists will be aware of this website's work and make forecasts public in one of their broadcasts and prevent another outbreak disaster.
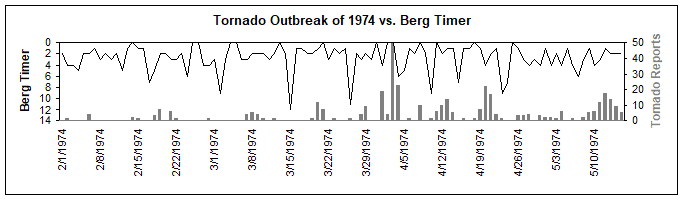
The Worst Tornado Outbreak in U.S. History
The most widespread tornado outbreak in U.S. history occurred April 3-4, 1974. 330 people died and 5,484 were injured during the 148 twisters in thirteen states. Seven category F5 tornadoes occurred on April 3, including the deadly Xenia Ohio twister. Below are all tornado reports during that period compared to The Berg Timer. What a strong correlation.
Tornadoes occurred during low BT periods just before and after high BT. The big April 3-4 outbreak occurred exactly at the lowest 3-day BT period on April 3.
Hurricanes, Typhoons, Cyclones and Tropical Storms
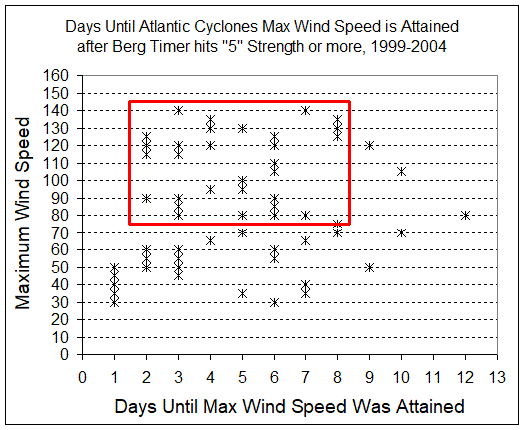
The below information was first published about 2004. The best time to be in the Caribbean is 4-5 days before strong BT days. The latest evidence shows that the 8 day window after a strong BT day for the strongest winds to occur is still accurate.
The chart above represents when Atlantic cyclones during the 1999-2004 seasons hit their strongest wind speeds after a Berg Timer of "5" strength or more. In the red box, all but 3 hurricanes hit their maximum strength 2 to 8 days after a BT "5" day. If it's necessary to be in the Atlantic/Caribbean area during hurricane season, you should schedule your visit away from the 2-8 day window occurring after a BT "5" day.
The wind speed charts for each season are shown below. The only misses were Hurricane Lili in 2002 and Isabel in 2003 when no BT=5 occurred. However, multiple "4's" occurred just prior to maximum winds of both.
The 2-8 day window for maximum hurricane strength probability discussed above is shown below for each occurrance of BT = 5 using a horizontal red line. Hurricane wind strength peaks 2-8 days after the Berg Timer = 5 or stronger. BT values are published two months ahead on the Precipitation Forecasting page.
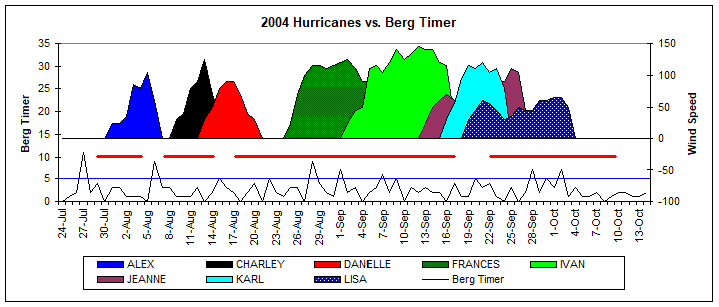
2004 Hurricane Season
BT forecasted that the 2004 season would be strong, with the 2-8 day window active for most all of the season.
 CHARLEY wind speed peaked 7 days after The Berg Timer = 11.
FRANCES peaked 5 days after BT = 9.
IVAN peaked 5 days after BT = 6.
JEANNE peaked 5 days after BT = 5.
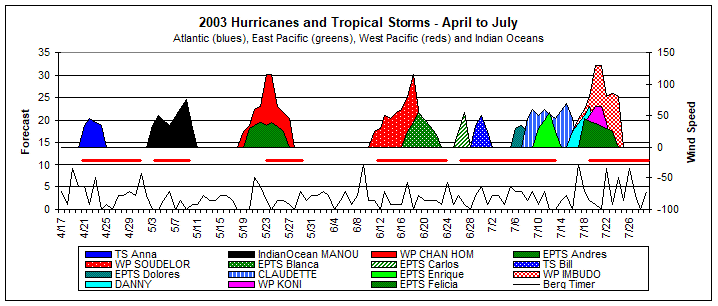
2003 Hurricane Season
BT forecasted the 2003 season with great accuracy, forecasting both genesis and peak strength.
Hurricanes are generated when daily BT hits "5" strength or greater. Then they hit their peak strength 2-8 days later.
You shouldn't plan on being in the Caribbean inside of a week after a spike in daily BT of value "5" or stronger and especially not with a daily Berg Timer value of "7" or higher. These forecasts are good for all cyclone generating areas in the Atlantic, Pacific and Indian oceans.
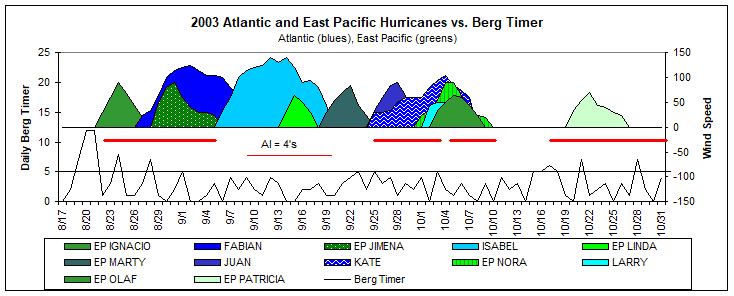
The Eastern Pacific Hurricane IGNACIO began one day after a very strong BT "12" day. Hurricane JIMENA began precisely on an BT "7" day. Note that no new hurricanes formed in early to mid October when BT was very low. Then Patricia formed again after BT hit "6" strength on October 17.
Hurricane genesis begins at the same time in different oceans. On August 28 when BT hit "7", two hurricanes began within three days of each other, each in different oceans. And three cyclones began within two days of BT=5 on October 3 in two different oceans. Hurricane genesis shares the same cause, regardless of location. That cause is atmospheric change as represented by BT.
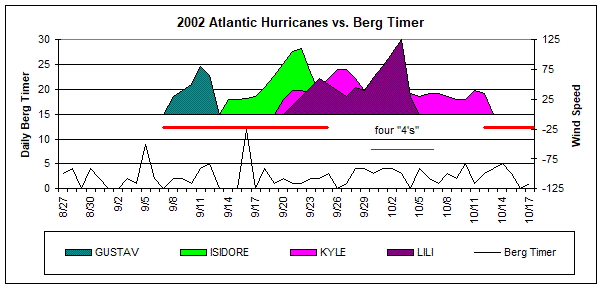
2002 Season
Below are the four hurricanes for the 2002 Atlantic season compared to the daily Berg Timer. The BT forecast for 2002 was published here several months before the 2002 season.
BT correctly forecasted the beginning of hurricanes GUSTAV, ISIDORE and KYLE. All three hurricanes began within two days of the two strongest BT days of the period, September 5 and 16. Hurricane LILI began within 3 days of the strongest BT day. There were no new hurricanes formed afterwards as BT calmed down. Note how LILI re-generated itself after four BT = 4's occurred on 9/28-29 and 10/1-2.
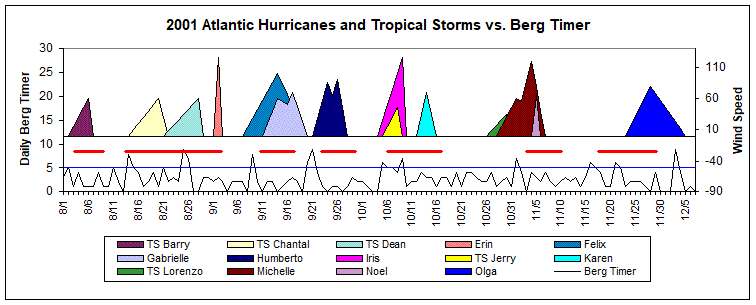
2001 Season
BT's 2-8 day probability window correctly forecasted all periods of the most intense wind speeds of 2001. Even with this busy hurricane season you still could have fit in some good Caribbean vacation time with the use of BT.
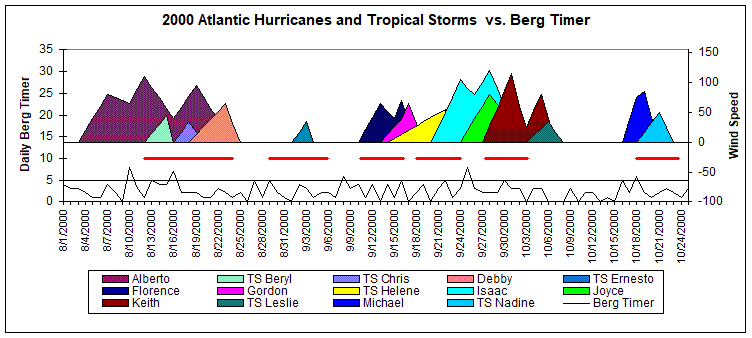
2000 Season
BT's 2-8 day probability window was very accurate in forecasting the strongest wind periods of 2000.