Whole Earth Forecaster Home
There is one aspect in the cycles of war that I find particularly fascinating. International battles clearly have their counterparts in both biological and economic cycles . . . In my own mind I picture the space in which we live as filled with forces that alternately stimulate and depress all human beings---make them more or less optimistic, or make them more or less fearful. These forces create a climate that is sometimes more favorable to war and sometimes less favorable . . . What mysterious forces cause these war cycles, how they operate, and how we can control them---or their effects---may, in this nuclear age, be the most important discovery ever made by man.
Edward R. Dewey, Cycles-Mysterious Forces That Trigger Events, p. 157, Foundation for the Study of Cycles. 
Behavior
War
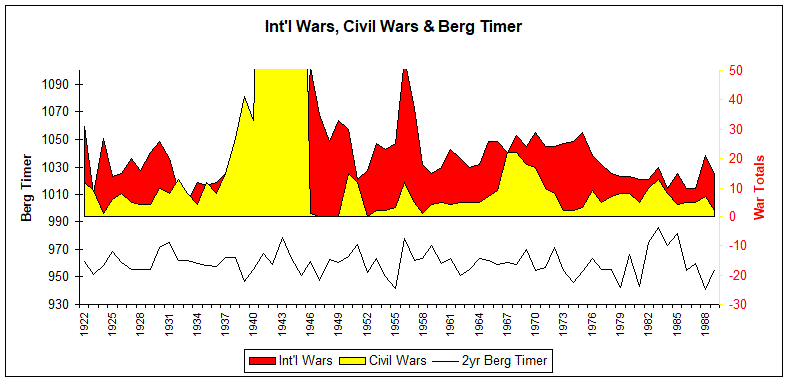
Below are compared the 2yr Berg Timer and Wheeler's Index of International Battles and Civil Wars from 1922 to 1989.
It's hard to deny there's something going on here. Whether it's caused by weather, the magnetic field or directly by solar activity, the Berg Timer is able to forecast the likelihood of war. BT peaked in 2004 coinciding with the US/Iraq war.
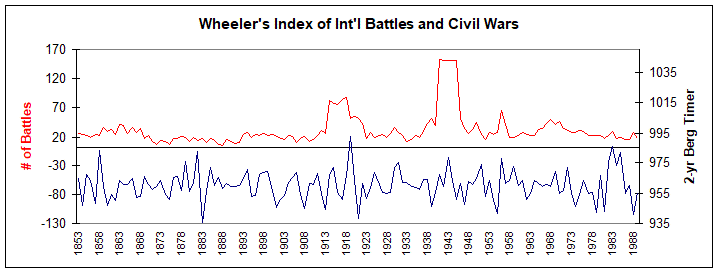
Below is the Total Wars Index (Int'l + Civil Wars) compared to 2yr BT since 1853.
Every major peak in BT corresponds to a major war outbreak. Also, the major BT lows correspond to war minimums. There are warlike events and skirmishes happening almost every year somewhere in the world. I have listed only major events:
 The third highest BT peak occurred in 1858, the Franco-Austrian War.
The double BT peaks in 1879 and 1882 coincide with the first Boer Wars of 1880-1881.
The 1894 BT peak coincides with the Sino-Japanese War of 1894-95.
The 1897-99 BT peak coincides with the Spanish America War of 1898, the 2nd Boer Wars of 1899, and Philippine-American War of 1899.
The 1906 BT peak coincides with the Russian Revolution of 1905-1906.
The 1911 BT peak coincides with the beginning of the Mexican Revolution.
The 1915 BT peak coincides with the beginning of World War I.
The BT peaks in 1922 and 1925 coincide with the Kurdish revolts in Iraq of 1922-24.
The BT peak of 1937-1938 coincides with the Spanish Civil War and the Nanjing Massacre.
The peak in 1941 and fifth highest peak in 1943 coincide with World War II.
The peak in 1946 coincides with the Greek Civil War.
The 1948 peak coincides with the First Kashmir War and the Israeli War of Independence.
The eighth highest BT peak in 1951 and another peak in 1953 coincide with the Korean War.
The sixth highest BT peak in 1956 coincides with the Suez War, involving Britain and France.
BT peak in 1969 coincides with the beginning of heavy U.S. involvement in Vietnam and major civil, racial, social and war-related protests in the U.S..
Major BT peak in 1972 coincides with Egypt's (Sadat) threat of war unless Israel withdraws from territories. Yom Kippur War begins in 1973.
The BT peak in 1980 marks the beginning of the Iran-Iraq War.
The major BT peak of 1982-83 coincides with the Falklands War (1982), Israeli Invasion of Lebanon involving Syria and PLO (1982-84) and Grenada (1983).
The 3rd lowest BT in 1988 coincides with world peace, most notably in the Middle East and the fall of communism in Eastern Europe and the Soviet Union.
The BT peak in 1990 coincides with Iraq's (Saddam Hussein) invasion of Kuwait, leading to the Persian Gulf War.
The BT peak in 1995 coincides with Chechnya and Grozny.
The plateau of BT in 2002-04 coincides with the 2nd Gulf War (Operation Iraqi Freedom) begun in 2003 and the US/Iraq war of 2004.
High BT shows probable periods of stress. Who can deny the significance of major climate and economic stresses on geopolitics? These stresses provide opportunity for revolutionaries and despots, who may otherwise remain quiet, to have cause to begin uprisings, conflicts, border incursions, territory takeovers or economic revolts which lead to war. BT does not cause war. BT is able to forecast times of climate and economic stress which may provide fertile ground for war.
Forecast: Click Here for the 10 year forecast to 2010 of 2-year Berg Timer.
Murder in the United States
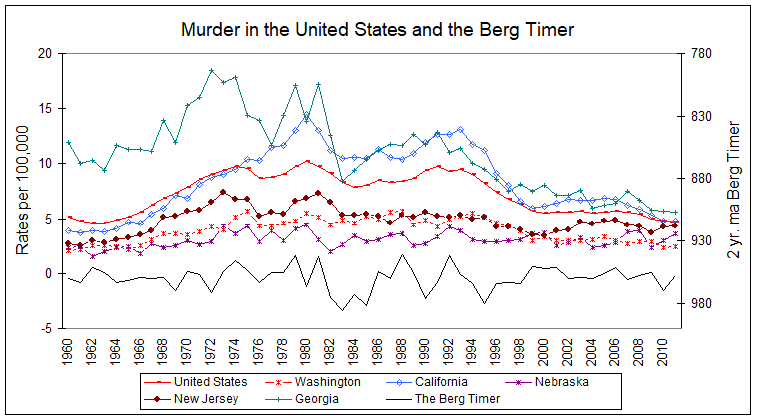
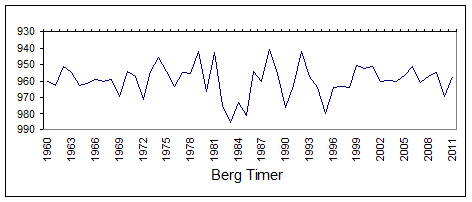
Below are compared murder rates in the United States and the 2-yr Berg Timer from 1960-2011.
Murder rates are shown for the four corners and middle of the United States (Washington, California, New Jersey, Georgia, Nebraska) and for the United States as a whole. High murder rates correlate negatively with BT so BT has been inverted in the chart above for easy viewing.
This demonstrates that trends in murder rates are fairly consistent regardless of geographic location. Since murder trends share the same trends regardless of location, it must be because all the areas share some same economic, weather or atmospheric cause which the Berg Timer can forecast. I believe it is a combination of economics and weather. When BT is low, murder rates are high. As shown on the weather and economics pages, low BT correlates with a weak economy and above normal temperatures, both proven to correlate positively as catalysts for emotional behavior and crime. The five major peaks of BT coincide with crime peaks. Note how BT has "quieted down" since 1999, and so has crime.
Assaults With Weapons
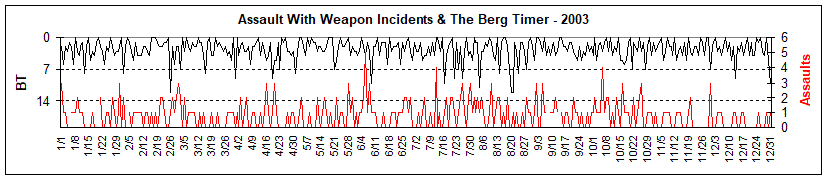
Below are compared daily Assaults With Weapons in Seattle and the Berg Timer for 2003.
High assault days cluster around the strong BT days. Assaults are least likely two days after the Berg Timer is "7" strength or higher.
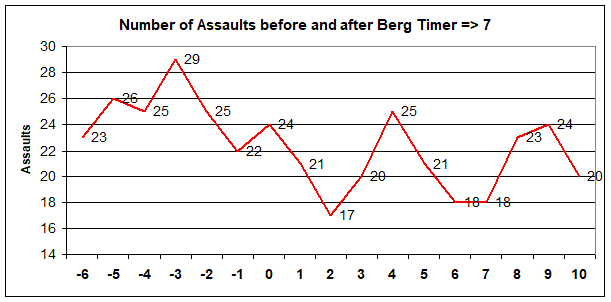
Below is the BT profile for assault-with-weapon totals on the days before and after BT > "7" for 2003. Up to 71% more incidents occurred during the seven days prior to day "2". Up to 47% more incidents occurred during the two days following day "2".
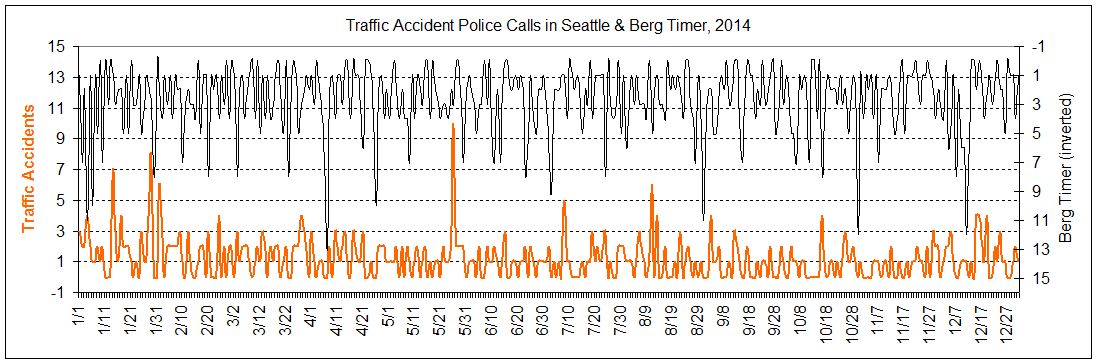
Traffic Accident Police Calls in Seattle, 2014
Just like most everything else, you can expect high accident rates during the low periods of BT just before and after high BT days.
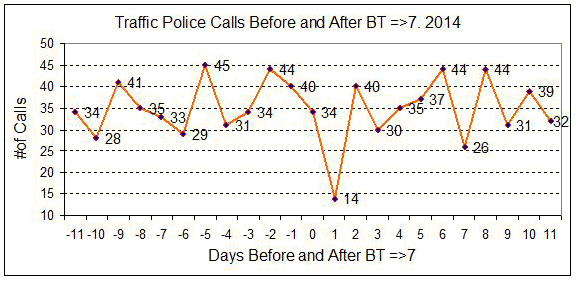
Below is the BT profile of the number of Police Calls before and after daily Berg Timer is equal to or greater than "7" strength.
Police Calls are lowest on day '1', the day after BT is strong, day '0'. The number of Calls triple in the previous and next 4-5 days. This would be a handy thing to know when planning officer needs in the future, saving money by cutting back on officers needed the day after BT=7 days and increasing officers available in the 4-5 days before and after that.
Aircraft Fatalities
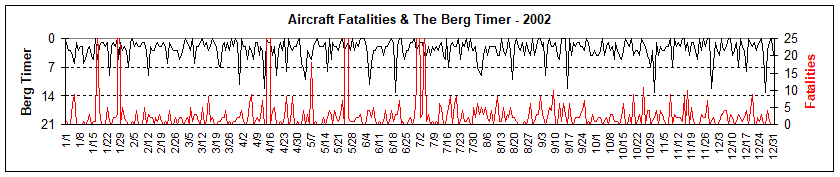
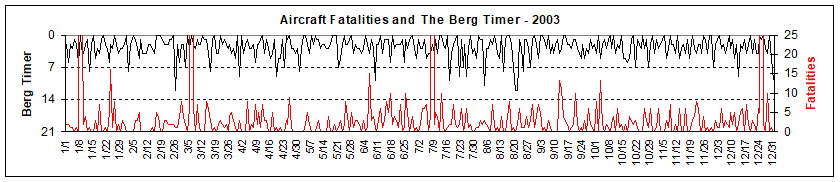
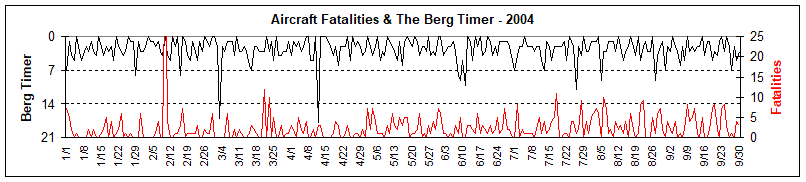
Below are compared daily aircraft fatalities and the Berg Timer.
Fatalities are least likely when BT = 7 or higher. This is probably due to the fact that high BT means weather and/or solar activity will be generally calm (see Weather page for more information on BT and weather). On the other hand when BT is very low, especially immediately after strong BT, weather is usually severe with higher winds.
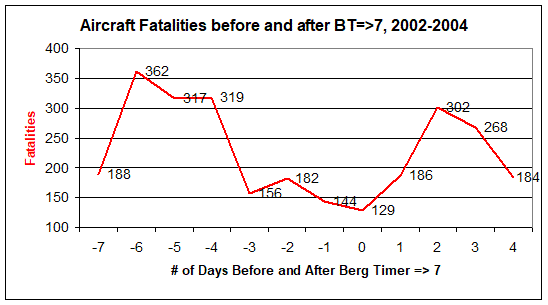
Below is the profile of the total number of fatalities which occurred before and after a strong BT day during 2002 to 2004. All days experienced more fatalities than day '0', when BT => 7.
There were as much as 181% more fatalities prior to BT = 7 than on BT = 7 days. There were as much as 134% more fatalities after BT = 7 days than on BT = 7 days.
Comparing the peak-to-low-to-peak profile to a perfect "V" produces a correlation coefficient of .835, a highly significant finding having only a 1 in 2,000 probability of occurring by chance.
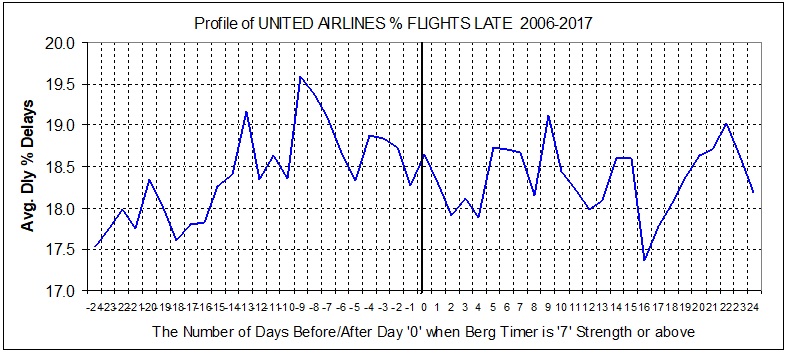
See below the new (2020) Expanded Profile of Airline Lates. This and fatalities are both affected by weather. It gives a much broader, more complete perspective capable of providing help in the planning of air travel.
Boating Accidents
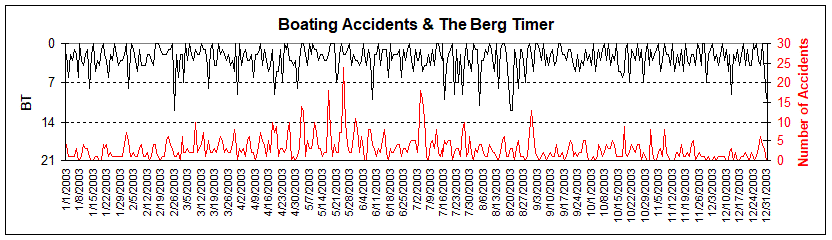
Below are compared daily Boating Accidents in Florida and the Berg Timer. High BT = Low Accidents.
There is a low probability of accidents occurring during high BT days.
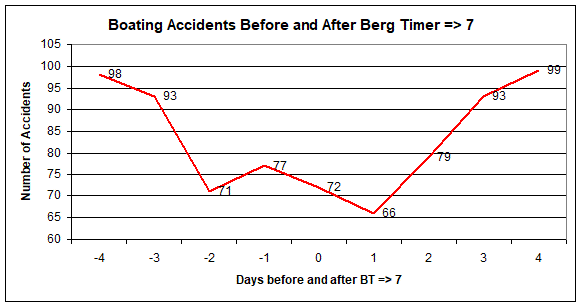
Below are the total boating accidents occurring on the respective days before and after BT => 7. Up to 48% more accidents occurred in the 1-5 days prior to day "1", and up to 50% more accidents occurred in the 1-3 days from the day after strong BT ("1"). Plan your boating around strong BT days.
data source: Justin Miller, Boating & Waterways Section, Florida Fish and Wildlife Conservation Commission,
Railroad Accidents
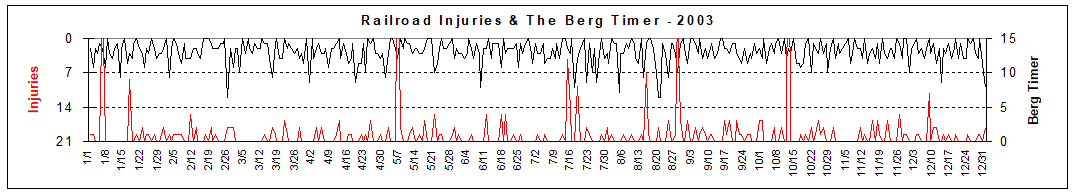
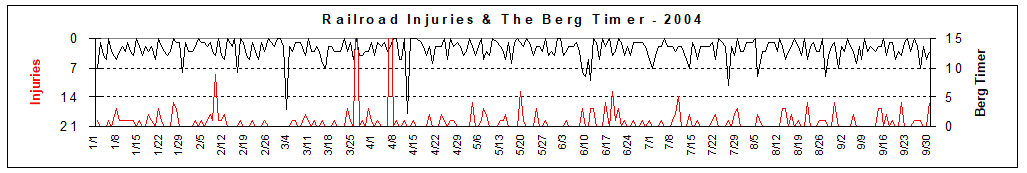
Below are compared daily Railroad Accidents and the Berg Timer. As with Aircraft and Boating accidents above, High BT = Low Incidents.
See how low accidents happen when BT is high. And are high just before and after high Berg Timer.
Railroad accidents are most often due to human error which is complicated by bad weather. BT is able to forecast these bad weather periods and so is able to forecast the likelihood of human error leading to aircraft fatalities, railroad, and motor vehicle accidents.
Fire Incidents
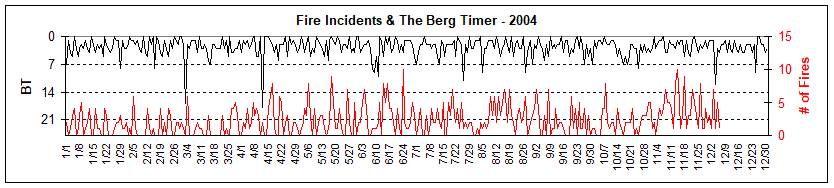
Below are compared daily Fire Incidents in Youngstown Ohio and the Berg Timer for 2004.
Fires are least likely when BT is "7" strength or higher.
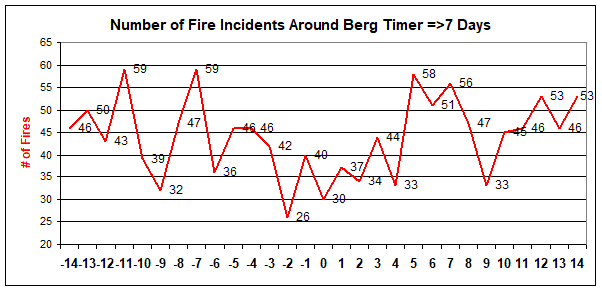
Below is the fire incident totals profile on the days before and after BT => "7" for 2004. Up to twice as many incidents occurred during the two weeks before and after when the Berg Timer was equal to or greater than "7" strength.
Youngstown is the only fire department I could find online that lists all its fire incidents. I'll look for other locations to confirm these results.
Hospital & Psychiatric Admissions, Incidents
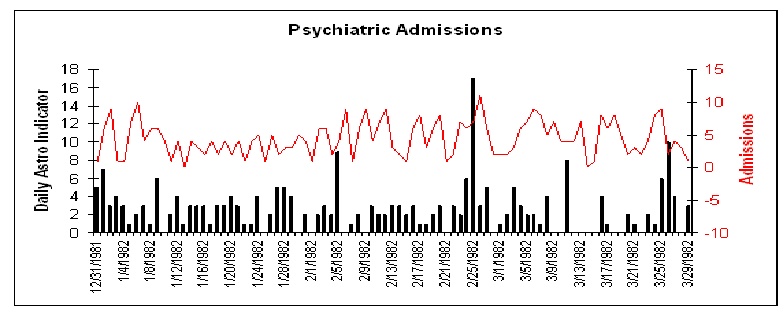
The daily, weekly and monthly Berg Timer has been shown to be an effective tool for managing health care services. Medical admission forecasting as well as the onset of various medical conditions can be forecasted by BT. Below are compared psychiatric hospital admissions and daily BT in 1986.
There's good positive correlation here. The top three BT days correspond with the top three admission days. Also, the lowest point of BT in mid-March corresponds with the lowest admissions.
data source: A medical doctor at the clinic who wants name witheld.
Omaha Homicides
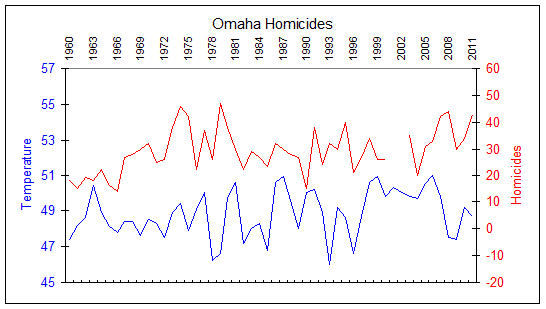
Below are compared yearly homicides in Omaha, yearly temperature in Nebraska, and the Berg Timer.
All share quite a few peaks and bottoms, adding credence to the temperature/behavior studies quoted on the Evidence page. It also supports other BT/temperature studies showing that low BT=warm temperature. So since BT can forecast weather it can forecast when crime will be more probable.
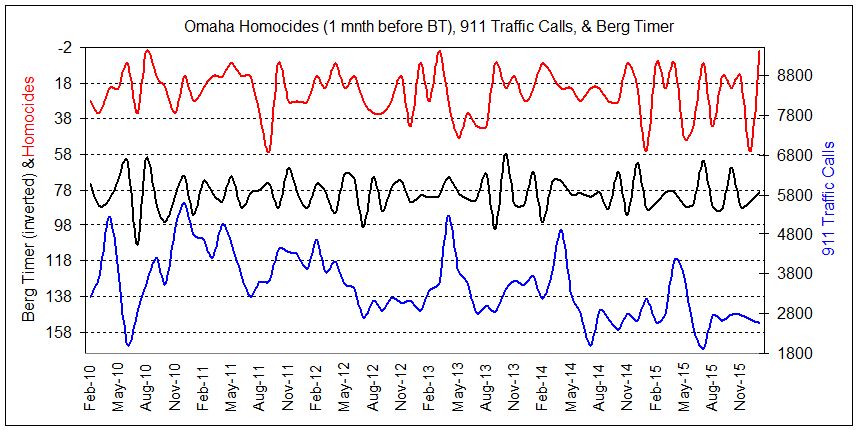
Omaha Homocides and 911 Calls
Monthly homocides and 911 Emergency Calls can be forecasted by monthly BT. See below Omaha homocides and 911 calls compared to monthly Berg Timer. For homocides it's shifted one month later for best fit. Again, like most every indice, you can expect most activity in the low BT periods just before and after high BT.
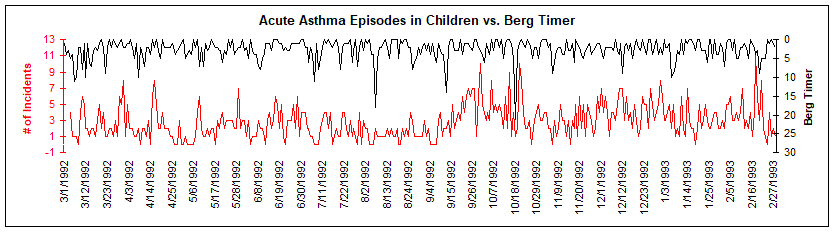
Asthma Episodes
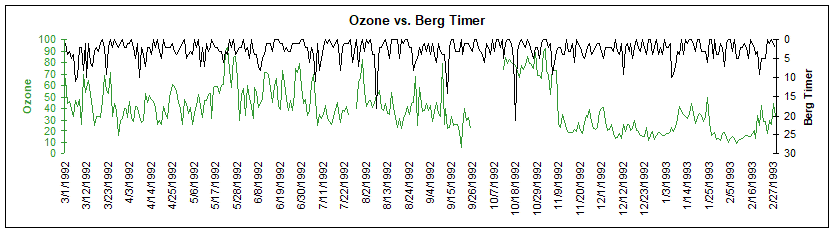
Below are compared Asthma incidents occurring in the United Kingdom and the Berg Timer from March 1992 to February 1993.
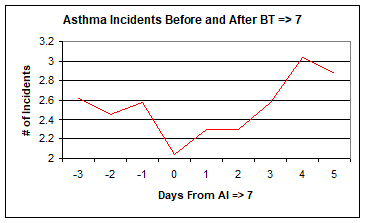
The profile below shows that there is a 50% increase in asthma incidents after strong BT (day "0). Note that the strongest 5-day asthma period of the year occurred just before and after the strongest BT day of the year in mid-October.
A possible explanation for this is that the Berg Timer is able to forecast atmospheric changes and weather. There are numerous studies showing the link between asthma episodes and ozone strength in the air. Below is ozone for the same period and the same location.
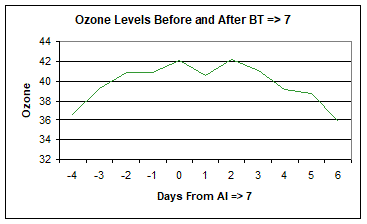
As shown in the profile below, ozone levels are significantly higher when BT hits "7" strength (day "0"). This may account for the fact that asthma episodes increase immediately after BT => 7.
Association between air pollution and acute childhood wheezy episodes: prospective observational study, BMJ 1996;312:661-665 (16 March), Roger Buchdahl. Follow up study: Buchdahl R, Daman Willems C, Vander M, Babiker A. Associations.
Pneumonia & Influenza
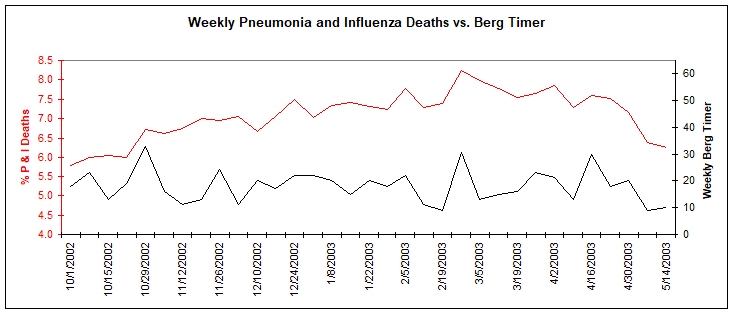
Below are the percent of patients who died from pneumonia and influenza (departure from normal) and the weekly Berg Timer from October 2002 to May, 2003.
There are scientific studies finding that high solar activity/geomagnetism correlates positively with an increase in micro-organism activity. So it's not surprising to find this very similar comparison. High solar activity also correlates positively with high cardiac arrest deaths (see this Evidence ITEM.)
Fishing Production
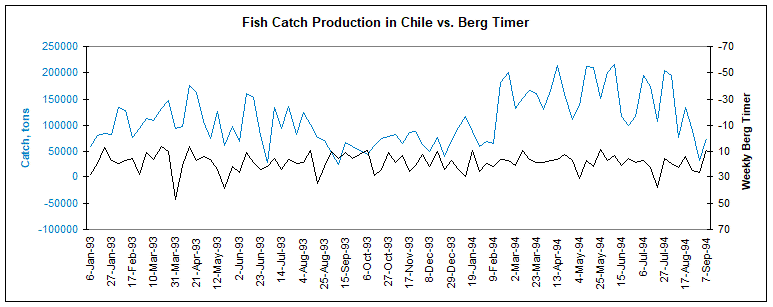
Fishing catch can be accurately forecasted by the Berg Timer.
Fish catches are decidedly low when major lows occur in the Berg Timer. This is most probably related to BT's ability to forecast atmospheric change and El Nino which affects the depth at which fish swim. When fish swim deeper in order to find cooler waters and/or more food the fish catch will be lower due to the inability of nets to catch them at lower depths.
The major lows of BT in early March '93, 31 March '93, late May '93, 29 April '94, and 20 July '94 were all times of very low fish catches. What a great time to stay in port and work on the boat or just relax. On the other hand, don't stay in port when BT is peaking. Get out there, the catch will be just fine!
Automobile Accidents